Introduction
The Indonesia Livestock Operations Dashboard provides comprehensive visibility into agricultural supply chain operations across one of the world's largest archipelago nations. Managing livestock trading across Indonesia's diverse geography requires sophisticated monitoring and analytics capabilities.
The Challenge
Livestock trading operations in Indonesia involve coordinating between thousands of farms spread across multiple provinces, each with different conditions, regulations, and logistics challenges. Operators lacked real-time visibility into farm health, financial performance, and supply chain status, leading to suboptimal decisions and missed opportunities.
The Solution
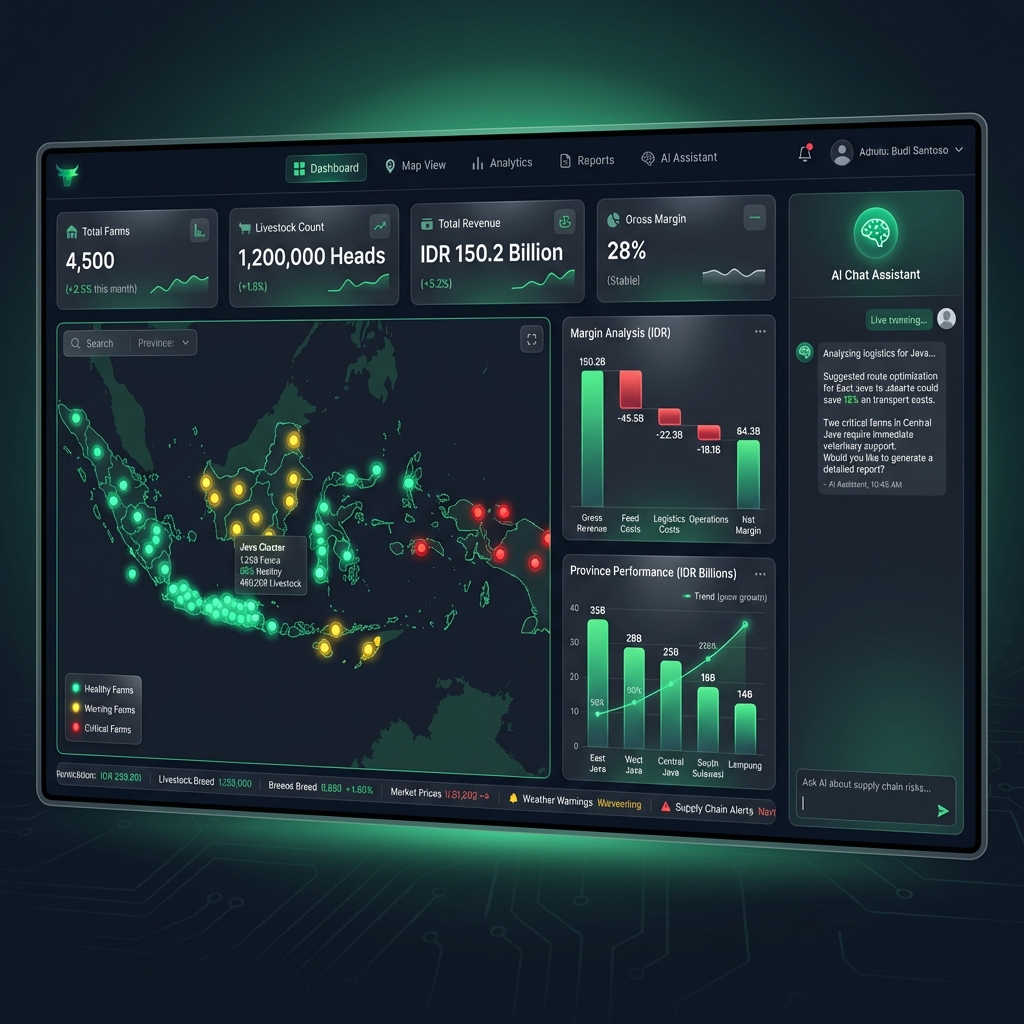
We built a command center-style dashboard with interactive geospatial visualization, enabling operators to monitor operations from national overview down to individual farm details. AI-powered analytics provide insights and forecasting while maintaining the ability to drill down into specific data points.
Technical Deep Dive
Created custom SVG-based Indonesia map with province boundaries and dynamic farm marker clustering
Implemented health-based color coding with real-time updates from farm monitoring data
Built multi-dimensional KPI tracking with drill-down from national to province to individual farm levels
Integrated Google Gemini AI for natural language queries and contextual operational recommendations
Designed financial analytics including margin waterfall charts, AR/AP tracking, and profitability breakdowns
Key Features
Interactive Map
SVG map with clustered farm visualization, health indicators, and zoom-to-detail functionality
Financial Analytics
Margin waterfall, price band analysis, AP/AR tracking, and province-level profitability
AI Assistant
Streaming chat interface for natural language queries about operations and recommendations
Supply Chain View
Logistics tracking, inventory levels, and demand forecasting across regions
Alert System
Real-time notifications for health issues, financial anomalies, and supply disruptions
Results & Impact
- ✓Provided visibility across 4,500+ farms in the monitoring network
- ✓Reduced decision-making time by 60% through consolidated dashboards
- ✓Identified supply chain inefficiencies saving 15% on logistics costs
- ✓Enabled early detection of health issues reducing livestock losses by 25%
Lessons Learned
"Geospatial visualization at scale requires careful performance optimization and clustering strategies"
"Agricultural stakeholders prefer familiar chart types—innovation should focus on insights, not visualization novelty"
"AI assistants are most valuable when grounded in real-time operational data"
Conclusion
This project demonstrates how modern web technologies can transform traditional industries. By providing comprehensive visibility and AI-powered insights, we've enabled better decision-making across Indonesia's agricultural sector.
Interested in a Similar Project?
Let's discuss how I can help bring your ideas to life.
Get in Touch